SIR epidemic model as a Markov chain
A stochastic SIR epidemic on a finite population, modelled as a discrete time Markov chain, simulated with Monte Carlo and compared with its deterministic limit.
- Role
- Author
- When
- 2025/2026 academic year
- Course
- Probabilistic Models (Modelli Probabilistici)
- Stack
- Python, NumPy, SciPy, Matplotlib, pytest, LaTeX
Context
The SIR model splits a population of size N into susceptible, infectious and removed people. The textbook version is a system of differential equations, which describes an infinitely large population where everything is smooth and deterministic. Real outbreaks in small populations are neither: whether the first few infections spread or fizzle out is largely down to chance. The goal of this project was to model that randomness properly and compare it with the classical equations.
The model
The state of the population at time t is the triple (S, I, R), with S + I + R = N. At each step two things happen, both random:
- each susceptible person gets infected with probability βI/N, so the number of new infections is binomial,
Bin(S, βI/N); - each infectious person recovers with probability γ, so the number of recoveries is
Bin(I, γ).
This makes the process a homogeneous, finite state discrete time Markov chain. Every state with I = 0 is absorbing (the epidemic is over), and the chain reaches one of them with probability 1.
What I built
model.pybuilds the chain and its full transition matrix. The state space has (N+1)(N+2)/2 states, so for small N the matrix can be built and checked exactly.simulation.pyis a Monte Carlo engine with a command line interface (population, initial infections, β, γ, number of runs, seed).analysis.pycomputes statistics over the simulated trajectories, absorption quantities with first step analysis, and solves the deterministic ODE system for comparison.sensitivity.pyrepeats the experiment across values of the basic reproduction number R0 = β/γ.- A pytest suite checks the invariants of the model: the population is conserved at every step, each row of the transition matrix sums to 1, absorbing states stay absorbing and the removed count never decreases.
Results
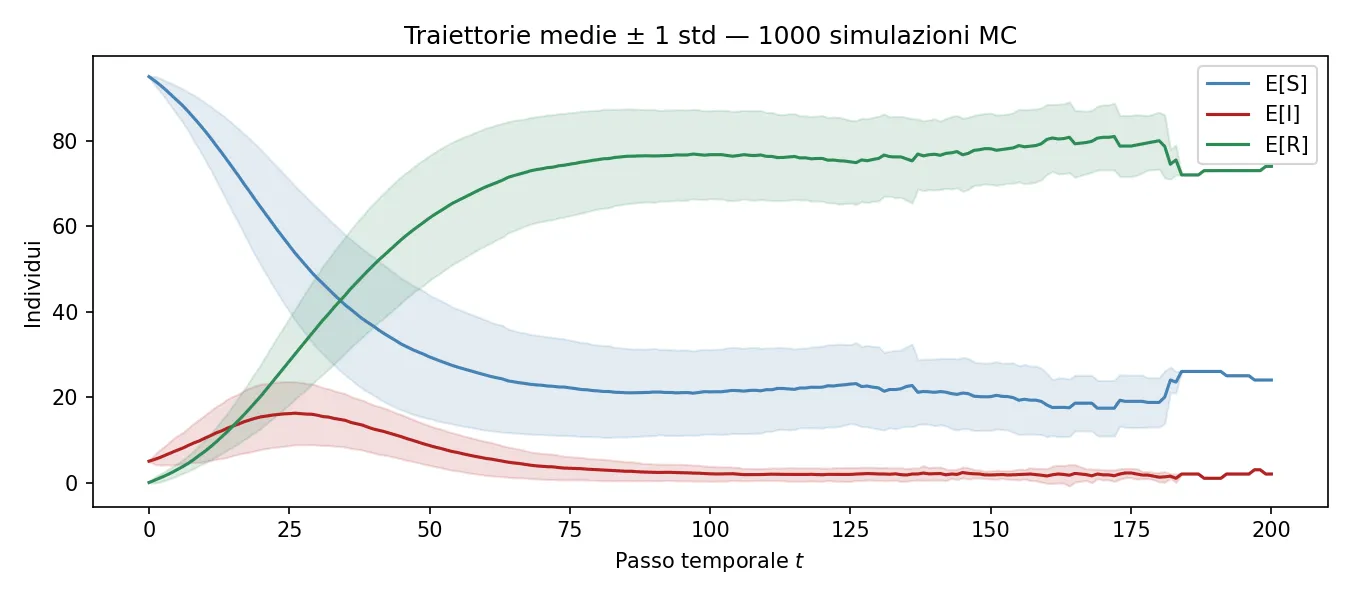
With N = 100, five initial infections, β = 0.20 and γ = 0.10 (so R0 = 2), the average of 1,000 simulated epidemics peaks at about 16.4% of the population infected at once, lower than the 18.3% peak of the deterministic equations. The reason is that random trajectories peak at different times, so their average is flatter than any single curve. As N grows, the stochastic model converges to the ODE solution, as predicted by Kurtz's theorem. The sensitivity study shows the expected threshold at R0 = 1: below it, outbreaks die out quickly; above it, the final epidemic size follows the classical final size equation.
The results are presented in a Beamer slide deck and an interactive web page published with GitHub Pages.