
TruMetraPla — Industrial Sheet Metal Productivity & KPI Analytics
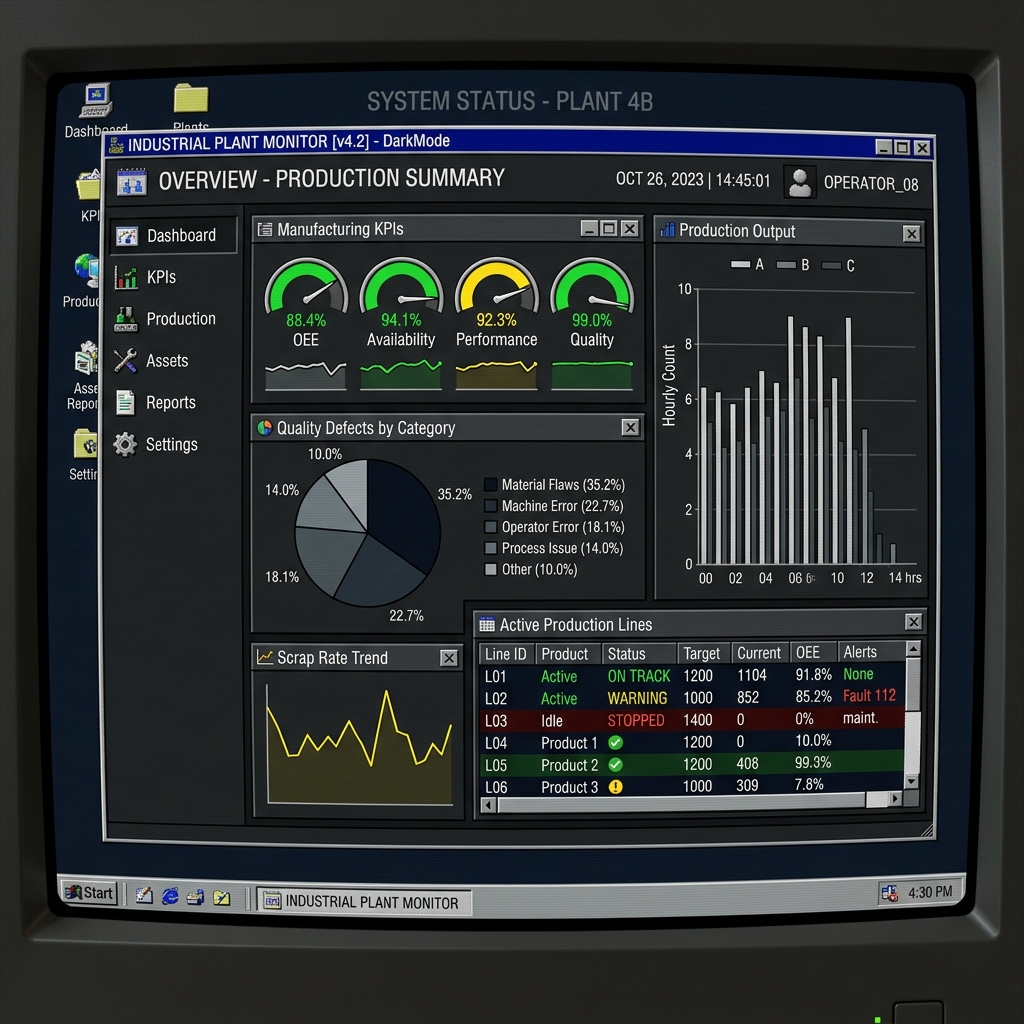
Interactive data dashboard written in Python (Streamlit/Pandas) to optimize productivity in metalworking production processes. It imports raw data from Excel files, cleans it, and calculates KPIs through rich and interactive data visualizations.
The Factory Challenge
Metalworking companies generate a frightening amount of data, often trapped in disconnected Excel spreadsheets. Finding production bottlenecks is like looking for a needle in a haystack, and it costs hours of manual work every week.
Architecture and Technological Choices
To ensure maximum backward compatibility on industrial PCs running Windows, I structured the application as a standalone executable that requires no external setup.
| Component | Technology | Motivation |
|---|---|---|
| Data Engine | Pandas (Python) | Capable of ingesting and aggregating thousands of rows in milliseconds. |
| Graphical Interface | Tkinter / ttkbootstrap | Native deployment on Windows machines without browser overhead. |
| Distribution | PyInstaller | The operator does not have to install Python. Double click and it starts. |
*Table 1: Architectural Choices of TruMetraPla*
# Example: KPI Aggregation on Pandas
import pandas as pd
def calculate_kpi(df: pd.DataFrame) -> pd.DataFrame: # Aggregates operator productivity and machine cycle efficiency return df.groupby("machinery").agg( produced_pieces=("produced_pieces", "sum"), mean_efficiency=("efficiency", "mean"), anomaly_count=("has_delay", "sum") ).reset_index() ```
The Result on the Field
The dashboard replaced hours of manual manipulation in Excel with a single click import process. Now operators monitor average productivity instantly, identifying efficiency drops via dynamic tables and interactive breakdown charts.